-
- A
DECADE OF DRINKING: TEN-YEAR TRENDS IN DRINKING PATTERNS IN
AUCKLAND, NEW ZEALAND, 1990-1999
- Sally Casswell and Krishna Bhatta
- Alcohol & Public Health Research
Unit, May 2001
- APPENDICES
- APPENDIX
A:
SURVEY DATA IN CONTEXT
- Alcohol
available for consumption (Statistics New Zealand)
- APPENDIX B: SAMPLE
DEMOGRAPHICS
- APPENDIX
C: DETAILS ON
RESEARCH METHOD
- APPENDIX D: VALIDITY
OF THE DATA
- Sensitivity
of Alcohol Consumption Measures
- Possible
Sampling and Measurement Errors
- Internal
Validity
- APPENDIX
E: TREND ANALYSIS
PROCEDURES
- APPENDIX
F: CALCULATION OF
ALCOHOL CONSUMPTION MEASURES
Alcohol
available for consumption (Statistics New Zealand)
- Data
on alcohol available for consumption (referred to here as 'available
alcohol') is supplied by Statistics New Zealand and is based on data
supplied by the alcohol industry for excise tax purposes. It takes into
account local production plus imports minus exports but does not include
home produced alcohol. (However,
these and other survey data indicate this contributes relatively little in
New Zealand).
-
- Direct
comparisons between available alcohol and the survey data are not possible.
Firstly, these survey data are from Auckland while the available
alcohol data relates to all New Zealand.
Secondly the survey data are based on 14-65 year olds and the
available alcohol estimate of per capita consumption is based on all persons
aged 15 and over.
-
- National
aggregate level data from Statistics New Zealand on alcohol produced and
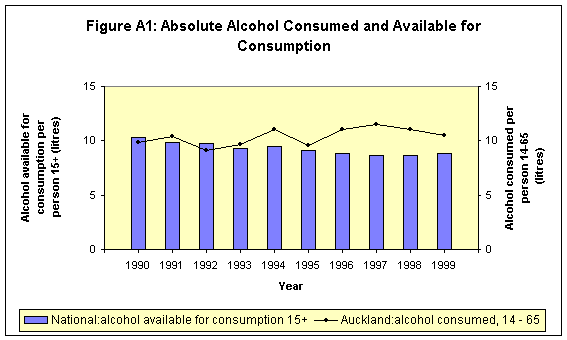
imported show a decrease between 1990 and 1999. The alcohol consumption in Auckland as shown by the Auckland
surveys did not decrease (Fig A1).

- The
difference between the two has occurred largely after 1995 when the Auckland
population began to include higher proportions of well educated and higher
income people. The higher
frequency of drinking by this group affected the frequency of drinking in
the total sample and contributed to the difference in total volume consumed
by Aucklanders compared with the national average for available alcohol.
-
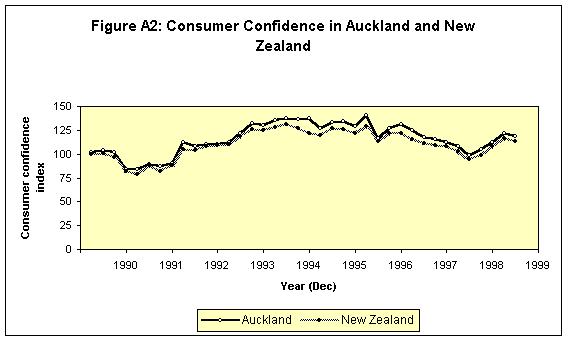
- Consumer
confidence, as measured by the Westpac McDermott Survey of Consumer
Confidence, has shown higher levels in Auckland than in New Zealand as a
whole. Frequency of drinking is
highly positively correlated with consumer confidence (0.82) and this is
another possible reason for the difference seen between Auckland and the
rest of the country. Similarly,
unemployment as measured by the Statistics New Zealand Household Labour
Force Survey has differed for Auckland, particularly in the periods of
unemployment decline, when Aucklandís rate has generally been half a
percentage point lower than the national rate.
Once again this may have contributed to higher aggregate levels of
consumption in Auckland.

Top
| Back | Next | Home

