-
- DRINKING
IN NEW ZEALAND
- National
Surveys Comparison 1995
& 2000
-
- Ruth
Habgood, Sally Casswell, Megan Pledger and Krishna Bhatta,
-
- Alcohol
& Public Health Research Unit, November 2001
- Respondents
were asked about their experiences of specific consequences of their own
drinking over the past 12 months. These will all be referred to as
‘problems’, although they clearly vary in impact. Respondents were asked
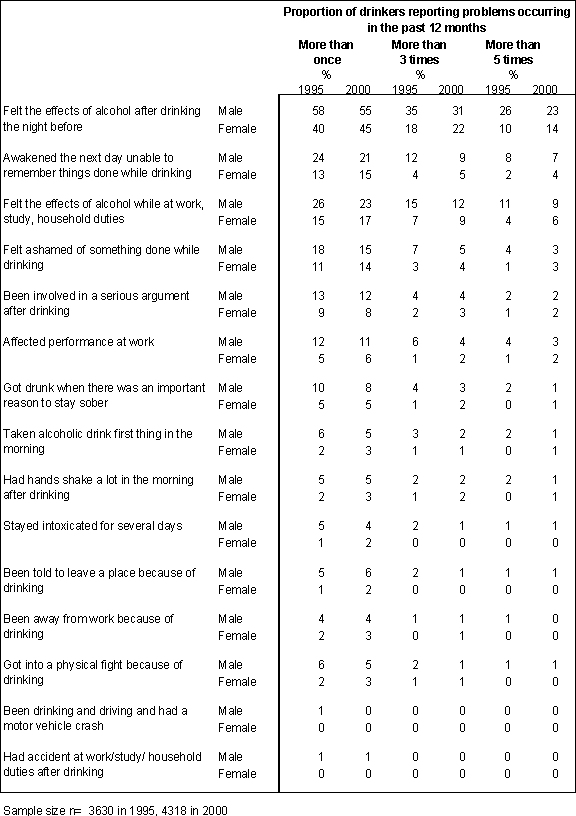
about 15 specific kinds of problems related to their drinking (see Table 4). In
2000, 61% of the men and 49% of the women reported at least one of the problems,
while 27% of men and 18% of women reported three or more. Five or more problems
were reported by 11% of men and 7% of women.
- There
was a decrease in the percentage of men reporting one or more problems in the
past 12 months (from 64% to 61%), whereas there was an increase among women
reporting one or more, from 44% to 49%. Similarly,
there was a decrease in the percentage of men experiencing five or more
problems, from 13% in 1995 to 11% in 2000, whereas among women there was an
increase from 5% in 1995 to 7% in 2000.
- Table
4 presents the proportions of men and women who had experienced each of the 15
problems. The general trend across all the problems was for the percentage of
men reporting problems to have decreased and the percentage of women to have
increased. For example, the percentage of men experiencing a hangover (the most
often reported consequence of drinking) at least three times in the last year
decreased from 35% of men to 31%. The opposite occurred for women who
experienced increases in the frequency of hangovers at every level analysed
(i.e. at least once, on at least three and on at least five occasions per year)
compared to 1995.
- The
same pattern was repeated for the proportions of men and women who had
experienced waking up the next day unable to remember things they had done while
drinking. The proportion of men experiencing this problem at least three times
decreased and the proportion of women having this experience at least once, at
least three times and least five times all increased. An equally common problem
was feeling the effects of alcohol while working, studying or doing housework.
There was a decrease in the proportions of men who experienced this problem at
least three times and at least five times and an increase in the proportions of
women experiencing these effects at least once, at least three times and at
least five times in the previous 12 months. These patterns were also repeated
for those who had felt ashamed of something they had done when drinking and had
got drunk when there was an important reason to stay sober.
- There
were increases in the proportions of women who had their performance at work
affected as a result of their drinking at least three times and at least five
times, and whose hands shook the morning after drinking at least once, at least
three times and at least five times, although the numbers of women affected were
relatively small (1-2%).
Table 4
Proportions of self-reported problems from own drinking
- Figure
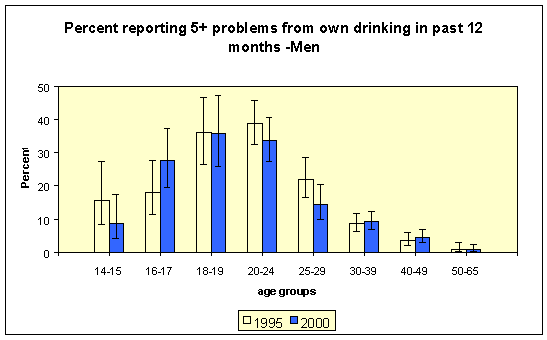
20 shows the percentages of men in each age group who reported at least five
problems. There were no significant changes in the proportion of men in any
individual age group reporting five or more problems between 1995 and 2000.
Figure
20
There
were increases in the proportions of women aged 30-39 (47% to 56%) and 50-65
(14% to 20%) reporting at least one problem. There were also increases between
1995 and 2000 in the proportion of women aged 16-17 (from 42% to 58 %) and 25-29
(from 19% to 29%) who reported three or more problems.
Figure
21 shows the women of different age groups reporting the experience of five or
more problems in the past 12 months. There was a strong increase in the
proportion of women aged 16-17 who reported five or more problems (from 14% to
30%) and a smaller increase for those aged 30-39 (from 3% to 6%).
Figure 21
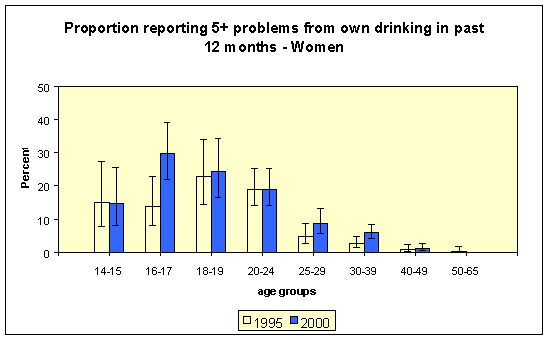
- Younger people were more likely to
report these problems; about one third of men aged, 16-17, 18-19, and 20-24
years and between 20% and 30% of women in those age groups reported experiencing
at least five problems in the past year. Since the 16-17 year olds showed large
increases in the amounts consumed, changes in the proportions of those
experiencing seven or more problems were explored for this age group. There was
a strong increase in the proportion of 16-17 year old women experiencing seven
or more problems, from 2% in 1995 to 13% in 2000. An increase from 8% to 12% for
men aged 16-17 did not reach the level of significance.
Reports of driving after drinking
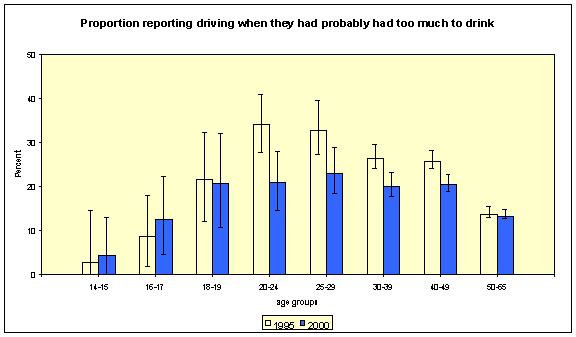
- Drinkers were asked how often they had driven when they had probably had
too much to drink. There were decreases overall in the proportion of men and in
the proportion of those aged 20-49 who had driven at least once when they had
probably had too much to drink (Figure 22). There were also decreases in the
proportion of men in the 20-49 age groups who had driven under these
circumstances between 1995 and 2000.
-
- The picture for women was mixed with no change in the over 30 age
groups. There was a decrease in the proportion of women aged 20-24 who had
driven at least once under these circumstances from 20% to 11%. Increases among
women aged 16-19, which were lower than other age groups in 1995, did not reach
the level of significance.
Figure 22
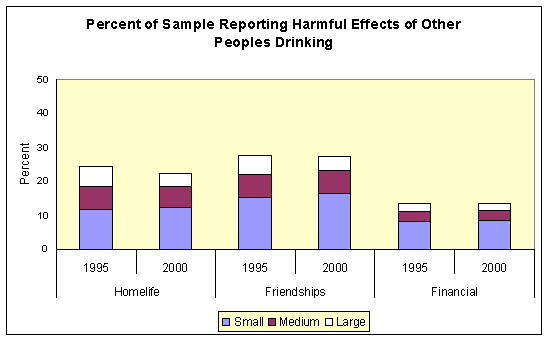
- People
were asked whether others’ drinking had had harmful effects on three areas of
their lives; their home life, friendships or social life, and financial
position, and also whether these had been small, medium or large harmful
effects.
- About
one in five reported some effect on their home life and more than one in four on
friendship or social life as a result of other people’s drinking. There was a
decrease in the proportion of the sample who felt there had been a harmful
effect from someone else’s drinking on their home life but no change in
relation to friendship and social life. More than one in ten of the sample in
both years felt there had been an impact on their financial position related to
others’ drinking and this was not different in 2000 from 1995 (Figure 23).
Figure
23
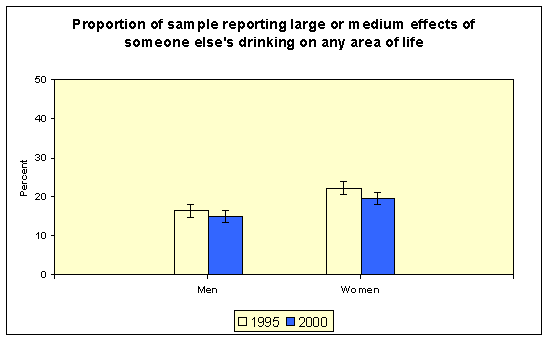
- The
proportions of men (15%) reporting large or medium harmful effects from
others’ drinking on one or more areas of life did not change significantly
between 1995 and 2000. The proportions of women reporting these effects
decreased from 22% in 1995 to 20% in 2000 (Figure 24).
Figure
24
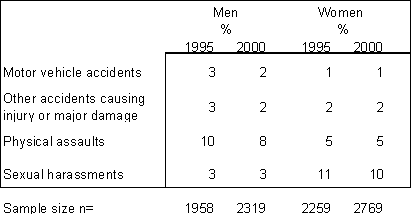
- Respondents
were also asked whether they had experienced four specific types
of problems as a result of others’ drinking. Table 5 shows that
men (8%) were more likely than women (5%) to report that they had
been physically assaulted by someone who had been drinking in the
previous 12 months, whereas women were much more likely than men
to report sexual harassment (10% compared with 3%). The
proportions of women and men reporting experiences of sexual
harassment and women reporting physical assault did not change
between 1995 and 2000. There was a decrease, however, in the
proportions of men reporting physical assault in 2000 compared
with 1995.
- Younger
people were the most likely to experience sexual harassment and
physical assault as a result of someone else’s drinking. Almost
one in five men aged 14-29 and more than one in ten of women of
the same age group reported that they had been physically
assaulted in the previous 12 months as a result of someone
else’s drinking. One in five women aged 14-29 stated that they
had been sexually harassed by drinkers (22% in 1995 and 19% in
2000).
- One
percent of women had been involved in a motor vehicle accident
resulting from someone else’s drinking in the previous 12 months
in both 1995 and 2000. The proportion of men experiencing this
problem decreased, from 3% in 1995 to 2% in 2000. For other types
of major accident resulting from someone else’s drinking the
figures also reduced for men from 3% to 2% but remained at the
same level for women (2%).
Table 5
Problems
experienced as a result of someone else’s drinking in the past 12
months
HOST
RESPONSIBILITY
- In
an effort to reduce problems associated with drinking in New
Zealand, there has been a focus on promoting responsible hosting
practices in both private homes and licensed premises. This
involves the host or server of alcohol taking responsibility for
their guests’ or patrons’ drinking. In licensed premises this
includes not serving patrons until, or after they are intoxicated.
It also includes no sales of alcohol to those under the minimum
purchase age. In licensed premises these provisions are required
by law.
- People
were asked about the likelihood that someone who was drunk would
be served alcohol in a range of locations with which they were
familiar. The majority of people who drank at pubs/hotels/taverns
in 1995 thought it was likely that a drunk would be served alcohol
there (79%) but this decreased to 73% in 2000. Two-thirds (67%) of
those who drank at sports clubs in 1995 thought it likely that a
drunk would be served at this location and this had also decreased
by 2000 (62%). Although most (78%) patrons of nightclubs also
expected that drunks would be served in 1995, this did not change
significantly in 2000 (76%). There was a slight increase, however,
in the proportions who thought a drunk person would be served at a
friend’s home (from 44% to 48%).
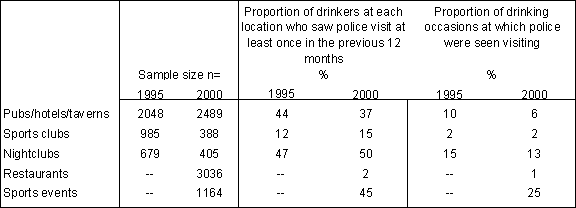
- Previous
research has identified the importance of proactive police
monitoring of licensed premises to increase the implementation of
the law (McKnight and Streff, 1994). Drinkers were asked how often
they had seen police visiting in the previous 12 months, while
they were drinking. There was a decrease in the proportions of
those who had seen police at least once in pubs/hotels or taverns,
from 44% in 1995 to 37% in 2000 (Table 7). Half the patrons of
nightclubs had seen police at least once in 2000 and 15% had seen
them in sports clubs. There was no change in either case from
1995.
- As
shown in the last two columns of data in Table 6, the proportion
of drinking occasions on which police were seen visiting
pubs/hotels decreased from 1995 to 2000, from 10% to 6% but did
not change significantly at sports clubs (2%), or at nightclubs
(13%).
Table
6
Police
visits to licensed premises
- All
drinkers under 20 were asked where they drank, how often they were
refused entry to various licensed premises or, once inside,
refused alcohol because of their age and how often they were asked
for age verification documents. In 1995, 18-19 year olds were able
to purchase alcohol if accompanied by a spouse, parent or guardian
over 20 and could purchase in the context of a meal. By 2000 the
law had changed to allow unrestricted purchase from licensed
premises for all 18-19 year olds and age verification documents
had been defined in law. For those aged under 18 it was illegal to
purchase alcohol, but not illegal to drink on licensed premises if
supplied by parents in either period.
18-19
year olds
- There
were few changes in the proportions of 18-19 year olds drinking in
any licensed location (Table 7). Pubs were the most popular
drinking venue for those aged 18-19 years (72%) and this had not
changed from 1995. There was an increase in the percentage of
those aged 18-19 drinking in nightclubs (from 60% to 68%) but this
was not statistically significant. Similarly a decrease in those
drinking at restaurants, cafés and coffee shops (67% to 60%) was
not significantly different but there was a significant decline in
those consuming alcohol in sports clubs (37% to 26%) and at sports
events (41% to 30%).
- More
than half of those aged 18-19 had drunk at special events such as
dances, music events and festivals in 2000 (58%). This location
was not asked about in 1995.
- Almost
eighty percent of men (78%) and almost seventy percent of women
(67%) aged 18-19 had consumed alcohol at pubs, hotels or taverns
in the previous 12 months and this had not changed significantly
for either group since 1995.
- There
were few changes for men or women at any location between 1995 and
2000, although there had been a decrease in the proportion of men
drinking at restaurants/cafés and coffee shops (from 72% to 58%)
and at sports events (from 54% to 40%).
- Not
surprisingly, given the introduction of the lower minimum purchase
age between surveys, there was a sharp decline in visits that
resulted in refusal of entry or refusal to allow purchase of
alcohol because of age on licensed premises. This occurred in both
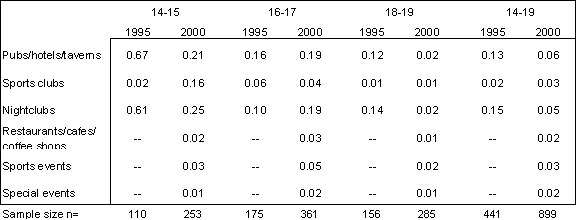
pubs and nightclubs where 18-19 year olds drank more than six
times as often as they experienced refusals in 1995 but more than
fifty times as often in 2000.[1]
There was no change in sports clubs where refusals were already
very low (Table 8).
- Requests
for age identification from 18-19 year olds were made about half
as often (0.46) as the number of times they had consumed alcohol
in a pub. The ratio of age identification checks to visits in
which alcohol was consumed was highest in nightclubs (0.57) for
this age group. It was much lower for sports clubs (0.22), sports
events (0.14), special events (0.15) and restaurants (0.6).
16-17
year olds
There
were no significant changes in the proportions of 16-17 year olds
drinking at least once in the previous 12 months in any of the
licensed locations. About one in four had consumed alcohol at least
once in pubs, hotels or taverns, at sports events and at sports clubs.
Slightly higher proportions had consumed alcohol in restaurants, cafés
or coffee shops (36%), but special events was where the largest
proportion of 16-17 year olds (57%) had consumed alcohol. Nightclubs
accounted for the lowest proportions (17% in 2000) (Table 7).
There
was also little change between 1995 and 2000 in the proportions of
males and females in this age group drinking in any location but there
was a decrease in the proportion of 16-17 year old females drinking at
least once in nightclubs in the previous 12 months (from 30% to 17%).
Refusal
of entry or refusal to allow purchase of alcohol increased in relation
to drinking occasions in nightclubs between 1995 and 2000 (from 0.1 to
0.2) but there were no significant changes in refusals for 16-17 year
olds in any of the other licensed locations. The ratio of refusals to
drinking occasions was still low, only one refusal for every five
drinking occasions in both nightclubs and in pubs but was even lower
(less than one refusal for every twenty drinking occasions at sports
clubs, sports events, special events and in restaurants, cafés and
coffee shops (Table 8).[2]
This
age group experienced somewhat fewer requests for identification as a
proportion of drinking occasions in licensed locations than 18-19 year
olds, 0.38 compared with 0.46 for pubs and 0.43 compared with 0.57 for
nightclubs. This could indicate that a higher proportion of 16-17 year
olds drinking in these locations might be obtaining their drinks from
someone 18 years or older. The ratios in other locations were even
lower and were also much lower than for 18-19 year olds, 0.06 for
sports clubs, 0.1 at sports events, 0.01 for restaurants and 0.03 for
special events.
14-15
year olds
The
most popular licensed drinking locations for the youngest drinkers,
those aged 14-15, in 2000 was at special events. Fifty-one percent of
14-15 year olds had consumed alcohol at special events in 2000.
Restaurants, cafés and coffee shops (27%) and sports events (19%)
also supplied a disproportionate number of 14-15 year olds with
alcohol compared to the other licensed locations (Table 7). Refusals
because of age in relation to drinking at these locations were very
low, less than one refusal for every fifty visits in which alcohol was
consumed (0.02) at special events such as dances, music events and
festivals and at restaurants and less than one to thirty (0.03) at
sports events (Table 8).
Fewer
14-15 year olds drank in pubs (10%) and nightclubs (2%) than at the
other locations. However, the ratio of refusals to drinking occasions
in pubs and in nightclubs was higher than in other licensed locations,
up to one request for every four visits (0.21 and 0.25 respectively in
2000). Decreases in refusals between 1995 and 2000 at these locations
did not reach the level of significance. The only location where the
refusals increased in relation to drinking occasions for 14-15 year
olds was in sports clubs, from 0.02 in 1995 to 0.16 in 2000. However,
this result was based on small numbers and should be interpreted with
caution. Only 7% of 14-15 year old drinkers had consumed alcohol in
sports clubs in the previous 12 months.
There
were few changes between 1995 and 2000 in the proportion of those aged
of 14-15 drinking in any of the licensed locations. There was a
decrease in the proportions drinking in sports clubs, from 14% to 7%.
There was an increase in the proportion of males aged 14-15 who drank
in restaurants, cafés and coffee shops (from 10% to 23%) and at
sports events, from 10% in 1995 to 24% in 2000. The ratio of refusals
to drinking occasions in these locations was low (0.02 and 0.03
respectively).
This
age group also experienced fewer requests for age identification in
relation to drinking occasions in pubs than 18-19 year olds, 0.31
compared with 0.46 for pubs but they were similar in nightclubs 0.53
compared with 0.57. Once again, it may be that a higher proportion of
under 18 year olds obtained their drinks from someone 18 or older in
pubs. Requests for age identification in relation to drinking
occasions in other locations were very low, less than one request for
every six drinking occasions in sports clubs (0.16), and at sports
events (0.13), and less than one to twenty five for restaurants (0.04)
and for special events (0.02).
Table
7
Proportion of 14-19 year old drinkers drinking in licensed
premises
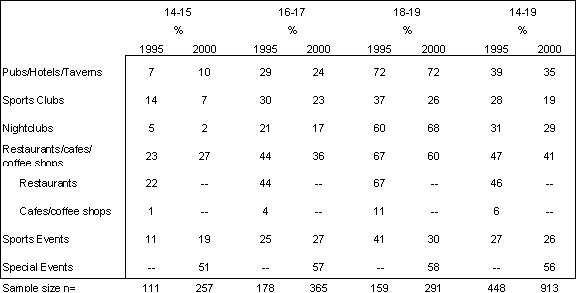
Table 8
Ratio of drinking occasions to
visits that resulted in refusal of entry or refusal to allow purchase
of alcohol on licensed premises
-
-
Refusals of those aged 18-19 years could still occur if age
verification documents were not produced.
-
Some visits in these locations may have been with parents or
guardians.
Drinkers
under 20 were also asked about their experiences buying takeaway
alcohol.
18-19
year olds
- There
was an increase in the proportion of 18-19 year olds who had
bought alcohol at least once from wine shops or wholesalers (70%
in 1995 and 83% in 2000). This increase was particularly marked
among women, from 54% to 79%. There was also a marked increase in
sales from supermarkets (26%-64%) but there were no significant
changes in the proportions of 18-19 year olds purchasing alcohol
from hotel/tavern bottle stores and from sports clubs. There was,
however, a decrease among males buying from hotel or tavern bottle
stores (Table 9).
- The
ratio of refusals to successful purchases by 18-19 year olds
decreased, as might be expected, to between 0.02 and 0.03 for all
the locations except sports clubs (0.1) and superettes or dairies
(0.12) where refusals in relation to purchases were slightly
higher (Table 10).
- The
ratio of requests for age identification in takeaway outlets to
successful purchases was more consistent than it was for licensed
premises. Almost twice as many successful purchases were made as
there were requests for age identification in sports clubs (0.49)
by 18-19 year olds. Around three purchases were made for every
request for age identification in supermarkets (0.36),
hotel/tavern bottle stores (0.33), wine shops (0.32) and dairies
(0.37).
- 16-17
year olds
- The
changes for 16-17 year olds between the surveys were in the
opposite direction. The percentages who bought alcohol at least
once in the previous 12 months from bottle stores in pubs, hotels
or taverns decreased from 30% in 1995 to 21% in 2000, and from 30%
to 19% for females aged 16-17. There was also a decrease in the
proportions buying from wine shops, from 31% to 23% but there was
no significant change for sports clubs (6%) (Table 9).
- Purchases
of alcohol from supermarkets have shown strong increases from 8%
to 15% of this age group.
- The
number of refusals compared to the number of successful purchases
increased sharply in supermarkets (from 0 in 1995 to 0.12 in 2000)
and sports clubs (from 0.1 to 0.36). Refusals as a proportion of
successful purchases were similar in wine shops (0.09) and in
hotel/tavern bottle stores (0.14) in 2000 and did not change
between 1995 and 2000 (Table 10).
- Access
to alcohol from superettes and dairies was not asked about in 1995
however, while only 2% had purchased alcohol there in 2000, the
refusal rate was higher in this location than in other takeaway
outlets with just under one refusal for every two successful
purchases (0.46).
- As
was the case for on-premise licensed locations, 16-17 year olds
experienced fewer requests for identification as a proportion of
successful purchases than 18-19 year olds. The number of attempts
to buy takeaway alcohol that resulted in requests for age
identification as a proportion of successful purchases was highest
in dairies, almost two purchases were made for every request for
age identification (0.45) and lowest in hotel or tavern bottle
stores, less than one request for every seven purchases and in
wine shops (0.13 and 0.11 respectively). The ratio of age
identification requests to successful purchases was about one in
five at sports clubs (0.19) and supermarkets (0.22).
- 14-15
year olds
- With
the exception of bottle stores, where the proportions of 14–15
year olds purchasing alcohol had decreased from 12% in 1995 to 5%
in 2000, there was little change between 1995 and 2000 in the
proportions buying takeaway alcohol at any location. In 2000 the
proportions of 14-15 year olds who had bought alcohol at least
once from bottle stores, wineshops and supermarkets in the
previous 12 months were much the same (5%, 8%, and 6%
respectively) (Table 9).
- The
number of refusals as a proportion of successful purchases rose
sharply between 1995 and 2000 in hotel/tavern bottle stores from
0.11 to 0.64. However, it should be noted that these changes are
based on small numbers and should be interpreted with caution
(Table 10).
- The
numbers of requests for age identification in each takeaway
location was very small for 14-15 year olds so results are not
reported for this group.
- Table 9
- Proportion
of each age group purchasing takeaway alcohol in previous 12
months

- Table
10
- Ratio of
successful takeaway purchases to refusals to allow purchase of
takeaway alcohol.

OTHER
SOURCES OF ALCOHOL SUPPLY FOR THOSE UNDER MINIMUM PURCHASE AGE
- In the 2000 survey those under 18, i.e. under the
minimum purchase age, were asked about sources of supply of
alcohol other than purchasing it themselves. They were asked how
often they had consumed alcohol purchased by someone else, who
bought it and who bought it for them the most often.
- 16-17
year olds
-
- Ninety percent of 16-17 year old drinkers had
obtained alcohol from another person at least once in the previous
12 months. Almost 60% of 16-17 year olds obtained alcohol at least
once every couple of months from another person and 44% at least
once a month (Table 11). More than a quarter of 16-17 year old
drinkers were being supplied with alcohol fortnightly to monthly.
One in ten were being supplied weekly to fortnightly by another
person.
-
- Friends predominated as a source of supply for 16-17
year olds with over two thirds obtaining alcohol from this source
at least once in the previous 12 months. Half of the drinkers in
this age group had been supplied alcohol by parents and one fifth
by siblings. One in ten had obtained alcohol from another family
member and a similar proportion from another non-family adult
(Table 12).
-
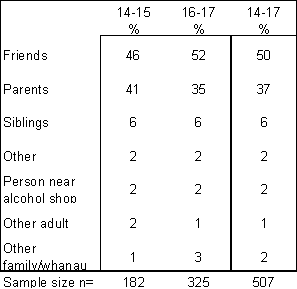
- Friends were also cited as the most frequent supplier for 16-17 year old
drinkers (52%). Just over a third of drinkers in this age group
(35%) received alcohol most frequently from parents (Table 13).
- 14-15
year olds
-
- Almost three quarters (71%) of 14-15 year old
drinkers had obtained alcohol from another person at least once in
the previous 12 months. One third of those aged 14-15 were
supplied with alcohol at least once every two months and one fifth
of 14-15 year old drinkers were being supplied at least monthly by
another person (Table 11). Twelve percent of 14-15 year olds, were
having alcohol purchased for them monthly to fortnightly and 6%
weekly to fortnightly- about half as many as 16-17 year olds.
-
- Friends
and parents were also the most common sources of supply for 14-15
year olds. Forty five percent of 14-15 year old drinkers had
alcohol purchased for them by friends, and 39% by parents in the
previous 12 months. About one in six had alcohol purchased for
them by a sibling (Table 12).
- Friends were also cited as the most frequent
suppliers by 14-15 year olds the most often (46%), as for 16-17
year olds, but almost as many 14-15 year olds were being supplied
most often by parents (41%) (Table 13).
-
- The most frequent suppliers for younger males aged
14-15 were parents (43%) followed by friends (39%) but for females
aged 14-15 this pattern was reversed. Friends supplied alcohol
most often (56%) followed by parents (38%). These gender
differences were not observed among the 16-17 year olds.
-
- Table 11
-
- Proportion of younger drinkers by
frequency of obtaining alcohol from someone else in the previous
12 months
-
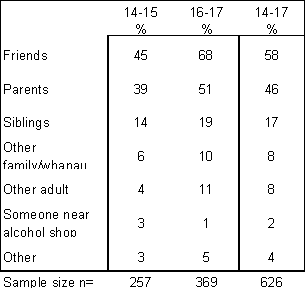
- Table
12:
- Proportion
of younger drinkers who had alcohol purchased for them in the
previous 12 months by source

*Note: Drinkers may obtain
alcohol from multiple sources
- Table
13
-
- Most
frequent purchasers of alcohol for younger drinkers
Top | Back |
Next
| Home


