-
- DRINKING
IN NEW ZEALAND
- National
Surveys Comparison 1995
& 2000
-
- Ruth
Habgood, Sally Casswell, Megan Pledger and Krishna Bhatta,
-
- Alcohol
& Public Health Research Unit, November 2001
- Respondents
were asked how often and what quantities they drank in a range of different
drinking locations.
-
-
- Figures
16 and 17 show the proportion of the total volume of alcohol consumed by
each sex at each drinking location in 2000.
-
- Figure 16
-
- Proportion of the total volume of alcohol
consumed by men at each drinking location, 2000
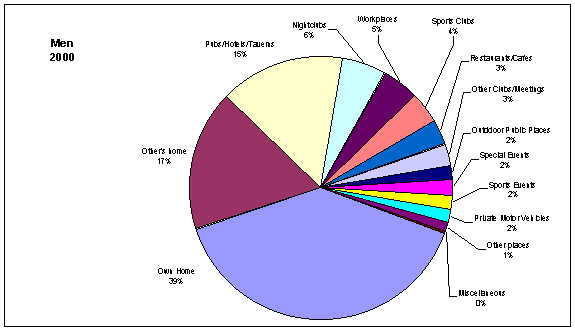
Note: Miscellaneous combines other bars, domestic flights, theatres and movies
and marae. Their combined total is less than 1%.
- Figure
17
- Proportion
of the total volume of alcohol consumed by women at each drinking
location, 2000
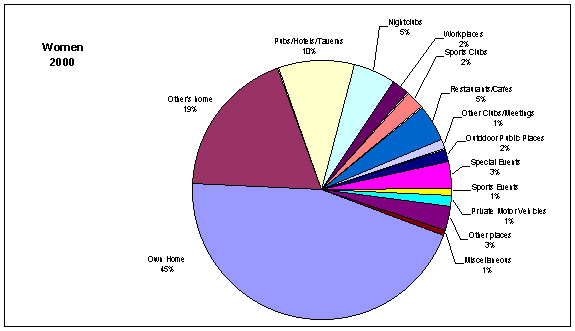
- Forty-five
percent of all the alcohol consumed by women was drunk at home and for men,
the proportion was 39%. Other people’s homes were also an important
location, accounting for around one fifth of consumption for women and
slightly less for men. Men favoured public drinking locations more than
women. Thirty percent of the men’s consumption and almost one quarter
(23%) of the women’s occurred in licensed premises
(pubs/hotels/taverns/bars, nightclubs, sports clubs, other clubs and
restaurants/cafés).
-
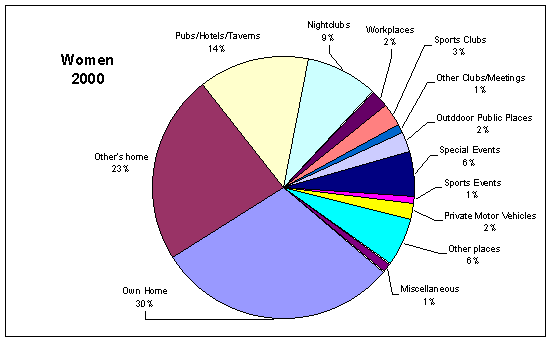
- Figures
18 and 19 show the total volume of alcohol consumed in heavier drinking
occasions by men and women, apportioned by location.
-
- More
of the alcohol consumed in people’s own homes was being consumed in
heavier drinking occasions in 2000 than in 1995 (36% in 2000 compared with
27% in 1995). There was also an increase in the proportion of alcohol
consumed in other people’s homes and in cars that was consumed in heavier
drinking occasions (from 52% to 62% in others’ homes
and from 47% to 69% in cars).
-
- The
locations which were over-represented in heavier drinking occasions for both
men and women were pubs, nightclubs, motor vehicles, outdoor public places,
marae and special events. Other people’s homes were over-represented for
men, and other bars and other places for women.[1]
The locations which were under represented in heavier drinking
occasions for both men and women were people’s own homes and restaurants
and cafés.
-
These comparisons are descriptive only.
- Figure 18
-
- Proportion
of total volume consumed in heavier drinking occasions by men by location,
2000
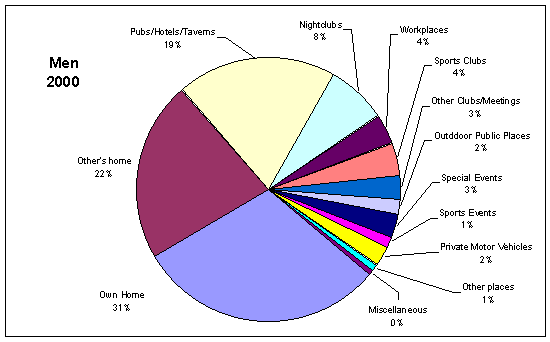
Note: Miscellaneous combines restaurants, other
bars, other places, marae, theatre/movies and domestic flights.
Figure
19
Proportion
of total volume consumed in heavier drinking occasions by women by location,
2000
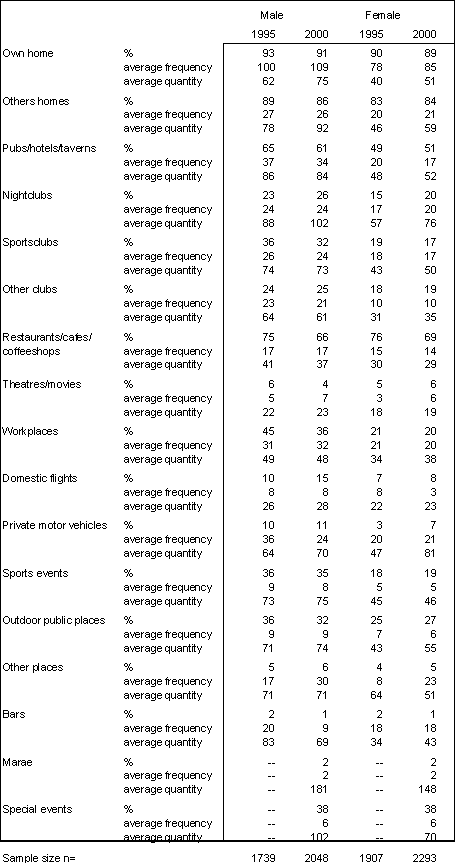
- Table
1 presents the percentages of male and female drinkers who consumed alcohol
at each location during the previous 12 months. For those who drank at the
location, the table also shows the average number of times people drank
there in that period and the average typical quantity (in millilitres of
absolute alcohol) consumed in each location.[1]
-
- About
90% of men and women drank in their own homes and other people’s homes.
Fewer men drank in other people’s homes in 2000, but women drank there
more often, and both men and women increased the quantities they drank there
from five to six drinks for men and from three to four drinks for women.
-
- There
was no change in the proportion of people who drank in their own homes, but
both men and women who did so increased both how often they drank and the
typical quantities they consumed there. There was an increase from four to
five drinks for men and from just under three to a little over three and a
half drinks for women.
-
- The
combined category of restaurants, cafés and coffee shops were also popular
with both men and women, but there was a decrease in the percentage drinking
in these locations in 2000. While those who patronised these locations drank
there as often, the quantities they drank went down (perhaps reflecting the
greater availability of café type locations, which were included in this
category) in 2000.
-
- There
was no change in the popularity of pubs for men, where about two thirds of
the men had had a drink in the past 12 months. Just over half of the women
drank in pubs in 2000 and this was a slight increase from 1995. Men drank
less often in both pubs and newer style bars in 2000 but there was no change
for women. Likewise, there was no change in the quantities consumed by
either group in pubs.
-
- About
one in three men had had a drink in a sports club in the past twelve months,
but this had decreased from 1995 and the frequency with which men drank
there also decreased. Women increased how much they drank at sports events,
while men’s consumption remained stable.
-
- About
one in three men had had a drink outdoors and one third drank at a sports
event. However, while the proportion drinking at sports events remained
steady, the percentage of those drinking outdoors had decreased.
-
- More
women drank in nightclubs and women increased the typical quantities
consumed there, from four to five drinks.
-
- Women
reported a marked increase in the typical quantities they consumed in cars
in 2000 compared with 1995. Men increased their typical quantities in
theatres or cinemas and on planes, where they typically drank between one
and two drinks.
- Well
over a third of men and women drank at special events such as festivals,
music events and dance parties. Due the nature of these events this was not
a frequent location for drinking but some of the largest average amounts for
any location were consumed there, almost seven drinks for men and more than
four and a half for women.
-
Restaurants, and cafes or coffees shops were asked about separately in
1995 but as one category in 2000. They have been combined in this table
for the purposes of comparison.
Table
1
Drinking
patterns at each location
Top | Back |
Next
| Home


