-
- DRINKING
IN NEW ZEALAND
- National
Surveys Comparison 1995
& 2000
-
- Ruth
Habgood, Sally Casswell, Megan Pledger and Krishna Bhatta,
-
- Alcohol
& Public Health Research Unit, November 2001
The
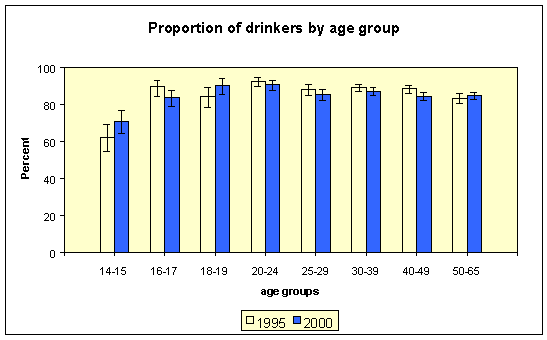
majority of people surveyed in 2000 (85%) reported that they were drinkers, that
is they had consumed alcohol in the previous 12 months. This had not changed
significantly from 1995 (87%).
Figure 1
Eighty-eight
percent of men and 83% of women aged 14-65 years were drinkers in 2000. There
was an increase in the proportion of 18-19 year oldwomen who were drinkers, from
78% in 1995 to 89% in 2000, and a decrease (88% to 82%) in the proportions of
women aged 40-49 who were drinkers.
There
were no changes in the number of drinkers between 1995 and 2000 in any of the
regions. However in 2000, as in 1995, there were significant differences between
the regions in the numbers of drinkers. In 2000, as in 1995, there was a smaller
proportion of drinkers in the Northern region (81%) compared with the other
regions. In 2000, 84% of the men and 78% of the women in the Northern region
were drinkers. The highest proportion of drinkers was found in the Southern
region (90%). In this region 92% of men and 89% of women were drinkers. This was
significantly higher than in all other regions. Eighty-six percent of the sample
said that they were drinkers in the Central and Midlands regions.
The
proportion of drinkers decreased in large cities (from 90% to 87%) and
metropolitan areas (from 83% to 79%) and was lower in metropolitan areas in both
1995 and 2000 than in all other areas. The proportion of women drinkers in
metropolitan areas and men drinkers in large cities has also decreased since
1995 but the proportion of male drinkers in small cities has increased.
VOLUME
OF ALCOHOL CONSUMED
The
volume of alcohol consumed by the sample was calculated from their responses to
how often and how much the respondents typically consumed in a number of
locations.
The
average annual volume reported for all drinkers in 2000 was 11.4 litres of
absolute alcohol per drinker. This represents a marked increase (2.0 litres or
21%) in the average volume reported consumed since 1995 (9.4 litres).
The
volume of absolute alcohol consumed by women rose from 5.4 litres in 1995 to 7.3
in 2000, an increase from seven to nine glasses per week.[1]
The volume consumed by men (16.1 litres Ė equivalent to 20 cans of beer per
week) did not change significantly from 1995.
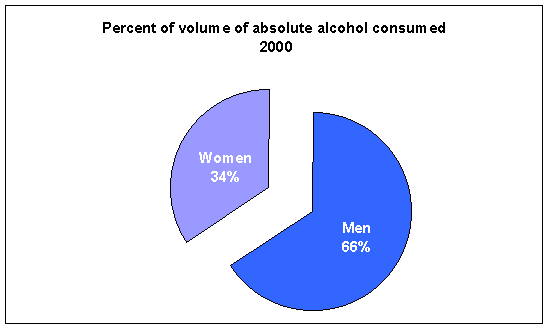
Males
consumed 66% of the total volume of absolute alcohol in 2000 while women
consumed 34% (Figure 2). The proportion of alcohol consumed by women in 2000
increased from 30% in 1995.
Figure 2
Distribution across the Sample
As
is commonly found in alcohol surveys, there was considerable variation across
the sample in the annual volume of alcohol consumed by drinkers as shown in
Figure 3. In both 1995 and 2000 more than half of the drinkers drank five litres
or less of absolute alcohol, or fewer than seven drinks per week. The percentage
consuming 10 or more litres per year increased from 27% in 1995 to 29% in 2000
and there was also an increase in those exceeding twenty litres (from 12% to
14%). These changes reflected increases in consumption among women and among
16-17 and 30-39 year olds.
The
proportion of 16-17 year olds consuming in excess of 10 litres rose from 20% to
30% and there was an increase in those aged 30-39 consuming in excess of 20
litres, from 11% to 14%.
While
there were no increases for men overall in larger volumes consumed, there were
increases among men aged 16-17 whose consumption exceeded 10 litres (from 24% to
38%) and among men aged 30-39 whose consumption exceeded 20 litres (from 18% to
24%).
The
percentage of women whose consumption exceeded 10 litres rose from 15% to 20%
between 1995 and 2000 and the proportion exceeding 20 litres from 5% to 7%.
There were also increases among women aged 30-39 whose consumption exceeded 10
litres (from 12% to 19%).
Figure
3
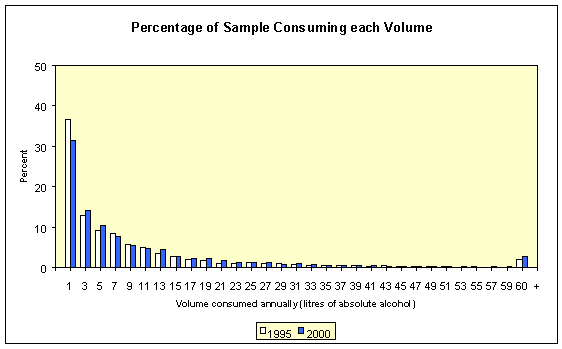
(The
data plotted in Figure 2 are in 2-litre groupings with the mid-point plotted.
There were a small number of drinkers (2.0% and 2.7% respectively) whose annual
consumption was 60 litres or more).
-
A small amount of the increase in the volume consumed from 1995 to 2000 can
be attributed to the addition of two new locations. Drinking in these
locations accounted for 10% (ie 0.2 litres) of the 1.9 litre increase in the
average volume consumed by women.
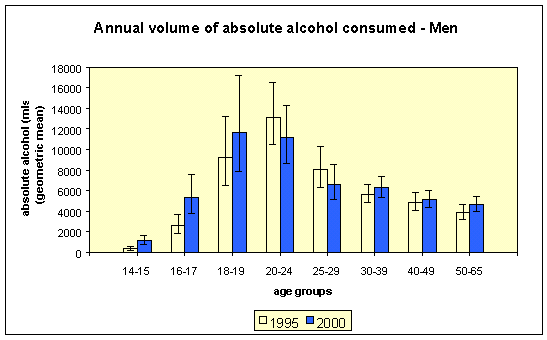
- Figure
4 shows the mean volume of alcohol consumed annually by men in
different age groups. In 1995 and again in 2000 there were marked
differences between different age groups, with the volume reaching
its peak at ages 18-19 in 2000. This is younger than in 1995 when
the largest volumes were consumed by 20-24 year old men.
- Among
male drinkers there have been marked increases in the volumes
consumed by younger age groups. The volumes consumed by those aged
14-15 increased from four to nine litres, an increase to the
equivalent of about 11 drinks per week, and from 8 to 20 litres
for those aged 16-17, or to about 25 drinks per week. The increase
among the 18-19 year olds and the decrease among those aged 20-24
and those aged 25-29 did not reach the level of significance.
Figure
4
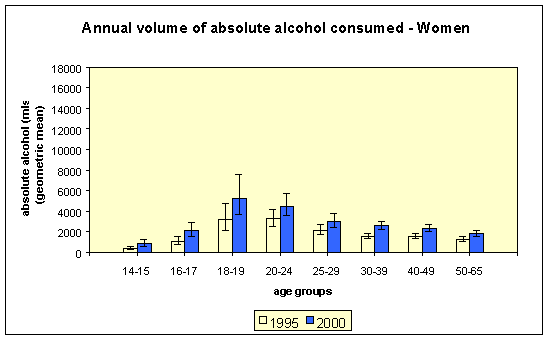
- Womenís
volume of drinking increased between 1995 and 2000 across all age
groups from 5.4 litres in 1995 (equivalent to seven drinks per
week) to 7.3 litres by 2000 (just over nine drinks per week).
There were significant increases in the volumes consumed by 14-15
and 16-17 year olds and by women in the over 25 age groups (Figure
5). The highest average quantities consumed by women were by those
in the 18-19 and 20-24 year old age groups (17 litres and 13
litres respectively).
Figure 5
- In
2000 there were differences in the volume of alcohol consumed
between the Central region, with the highest annual consumption,
and the Midlands, which had the lowest. There were also some
differences between regions in terms of changes between 1995 and
2000, with significant increases in annual volumes consumed in the
Central and Southern regions but not in the Midlands or Northern
regions.
- There
were increases in the annual volumes consumed by women in all
regions but increases in menís consumption in all regions did
not reach the level of significance.
- There
were also differences by level of urbanisation, with increases in
volumes consumed in large and small cities, small towns and rural
areas but not in metropolitan areas. Womenís consumption
increased in all settings and menís in rural areas.
- Because of the risk of alcohol-related harm associated with heavier
drinking occasions, estimates were made of how much of the alcohol
being consumed by the sample as a whole was consumed in heavier
drinking occasions. For this analysis these were defined as those
occasions in which men consumed eight drinks or more and women
consumed six drinks or more.
-
- The percentage of the alcohol consumed in these heavier drinking
occasions rose markedly between 1995 and 2000 (Figure 6). In 2000,
half of the alcohol market was being consumed in heavier drinking
occasions.
Figure 6
Percentage
of total volume of absolute alcohol consumed in heavier drinking
occasions

- There has been a marked increase in the
proportion of the total volume of alcohol consumed by men that was
consumed in heavier drinking occasions. In 2000 more than half of the
alcohol (53%) consumed by men was drunk in heavier drinking occasions
compared with 47% in 1995.
-
- For women the increase was even more
marked. The proportion of the total alcohol consumed by women that was
consumed in heavier drinking occasions rose from 31% in 1995 to 42% in
2000.
-
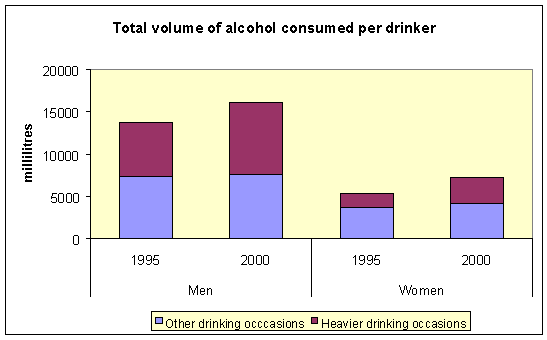
- Figure 7 shows the total volumes
consumed per drinker by men and women in heavier drinking occasions.
-
-
Figure 7
HOME
PRODUCTION
- Because
home production of alcohol is not subject to tax, it is not included
in the Statistics New Zealand data on alcohol available for
consumption.
- In
2000, 3% of respondents said they had made beer, wine or spirits at
home in the previous 12 months. In 1995 this had been reported by 4%
of the sample.
- In
2000, the amount produced accounted for about 4% of alcohol available
for consumption which had not changed from 1995.
Top | Back |
Next
| Home


